RFM analysis for a better segmentation
7min • Jan 15, 2024


Alexandra Augusti
Strategy & Operations Manager
RFM segmentation is an approach to classifying customers based on the recency of their last purchase, their frequency of transactions, and the monetary value of their total spending. These key measures provide an understanding of buying behavior, paving the way for personalized communications and tailored offers to build loyalty, enhance customer engagement, and prevent churn.
We have previously discussed the importance of customer segmentation in a previous article. Here, we’ll focus on RFM segmentation, a powerful method for defining marketing strategies. This detailed guide explains what RFM segmentation is, defines the RFM method, and discusses the targeting options and marketing strategies that result from it.
What is RFM Segmentation?
RFM segmentation is a marketing analysis method that aims to segment individuals based on three distinct criteria: recency, frequency, and monetary value. These key indicators correspond, respectively, to the time elapsed since the customer's last purchase, the total number of purchases made over a specific period (determined by the person who makes the analysis), and the total amount spent by the consumer during that period.
RFM segmentation is essentially a scoring model, assigning scores to customers based on these three axes. This RFM result is a synthesis of scores assigned to recency, frequency, and monetary value, usually scaled from 1 to 5.
All variables used in RFM segmentation attempt to quantify the level of customer engagement. It sheds light on buying behaviors and enables the offering of personalized and optimized deals to meet customer expectations.
R for Recency
Recency refers to the time elapsed between today and the customer's last purchase. It is expressed in days. For example, a recency of 35 means that the last purchase was made 35 days ago.
Note that the results of this variable should be analyzed in the context of your business / industry. Purchase cycles vary drastically from one sector to another, or even from one product to another. A high average recency is not necessarily a bad sign if the inter-purchase period is usually long.
F for Frequency
This indicator reflects the number of purchases made by a customer over a predefined period. Sustained frequency indicates loyalty and suggests a kind of buying “routine”.
The given period should be defined by your company, in line with the characteristics of your industry. For an e-commerce player, a quarter may be a good unit. Conversely, a real estate company with a much longer sales cycle should choose at least a year.
M for Monetary (Value)
Monetary value refers to the total spending of the customer within a defined time interval (the same as that used for frequency). The amount can be expressed in terms of revenue or margin, depending on your company's goals.
This variable helps determine the buyer's profile. A customer buying very frequently but in small amounts has a different profile than a customer buying less but with high spending.
The combination of these three dimensions reveals a customer profile rich in insights and unveils the intrinsic potential of each consumer, allowing for specific marketing strategies for each RFM segment.
How to Implement RFM Segmentation?
At this stage, you are likely convinced that RFM segmentation can help you in your marketing operations, but you may not know exactly how to proceed.
👉🏼 To do it effectively, here are the steps to follow:
Step 1: Collect Customer Data
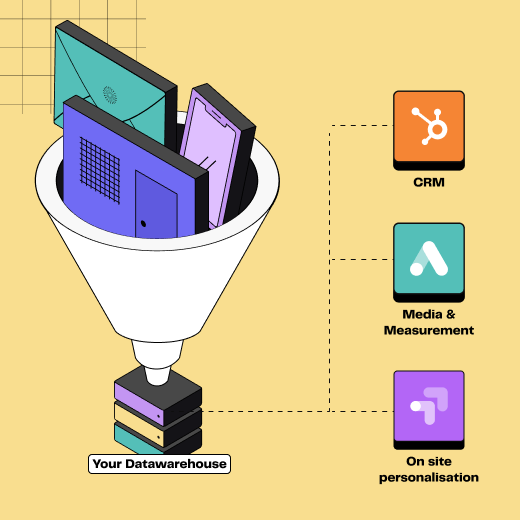
The collection and centralization of transactional data is the first crucial phase. Don’t panic. You have everything at your disposal! The key resides in knowing how to leverage it.
This data can be extracted from systems like CRM or e-commerce platforms and stored in a single source of truth (aka data warehouse).
Essential information includes:
Customer identity (e.g., name, email, or phone)
Date of the customer's last purchase
Total number of customer purchases during the defined period
Amount spent by the customer during the same period
Additional data can be collected to refine the analysis: type of product purchased, customer category, sales channel, etc.
Step 2: Calculate Recency, Frequency, and Monetary Values
Next, you need to calculate recency, frequency, and monetary values for each customer, as follows:
Recency: time elapsed since the last purchase, in days.
Frequency: quantity of purchases made during the chosen period.
Monetary value: total amount spent by (or total margin achieved on) the customer during the defined period.
These calculations can be done using tools such as spreadsheets (Excel, Google Sheets) or with the help of data teams (SQL, Python, etc.).
Note that if you sell very different products/services, it may be relevant to perform RFM segmentation by product/service type.


Examples of Recency, Frequency and Total Monetary values
NB: All data is fake data, used for illustrative purposes only.
Step 3: Assign a Score to Each Customer
The third step is to assign a score to these dimensions for each customer. This score typically ranges from 1 to 5, with 1 being the lowest and 5 being the highest. For example, a customer who purchased yesterday will likely have a recency score of 5.
Score thresholds should be established taking into account your specific knowledge of your market and the distribution of your customer values across these intervals.
Quintiles, which divide the data into five equal categories, are one of the methods that can be used for this classification. With this method, score 1 is assigned to the 20% of customers with the least favorable value of the studied indicator.
It is also possible to choose a broader scale to better segment your customer base.


Examples of R, F and M scores
(Optional) Step 3b: From R, F, M Scores to RFM Score
If you want to build an overall RFM score, you can do so by summing the R, F, and M scores and dividing the result by 3.
Depending on your context, it may also be relevant to weight each variable differently. Let's take the example of a real estate agent. Frequency is obviously low for house purchases. It is then possible to give more weight to the M variable.
However, we do not recommend using the RFM score as such. Instead, we recommend using the R, F, and M scores to create customer segments (see step 4).
Step 4: Analyze and Interpret the Segments
If you use a scoring scale from 1 to 5, you have 125 possible segments (5 x 5 x 5 combinations).
However, it would not be relevant to deal with so many segments. One approach is to multiply the F and M scores to limit the analysis to two variables for the final segment analysis.
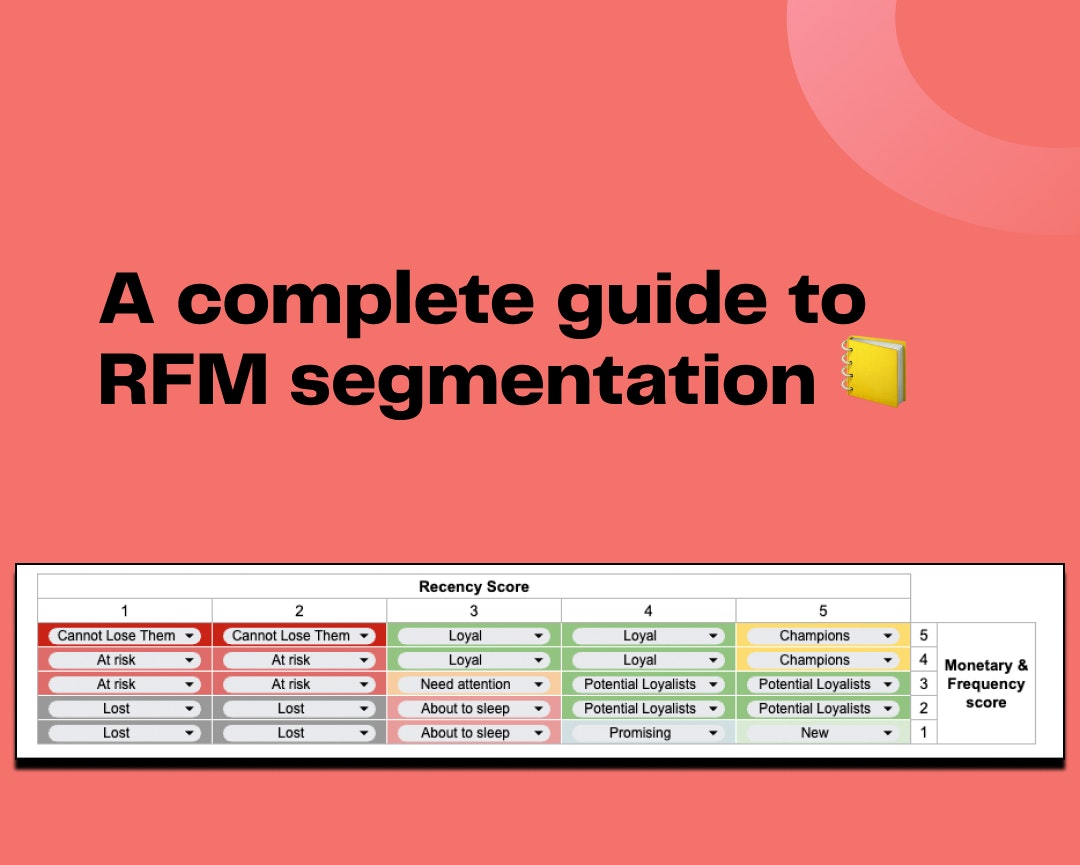
Thus, based on the scores, customers can be classified into segments according to the following table:


Example of RFM segmentation
The segments we use at DinMo are as follows:
About to sleep: customers who have recently made few purchases (in value or frequency).
At risk: customers who have not made a purchase in a long time.
Cannot Lose them: customers with high monetary value but low recency.
Champions: customers who have recently made high-value / frequent purchases.
Lost: customers who have not made a purchase in a long time with low monetary value/frequency.
Loyal: customers who make frequent purchases.
Need attention: customers at risk of being lost if no action is taken.
New: customers who have made a single recent purchase.
Potential Loyalists: customers to work with as they have the potential to make more purchases (in frequency or value) if more engaged.
Promising: promising customers who are likely to make more purchases in their lifetime.
Of course, there are no right or wrong segmentations. Feel free to define the one that best suits your needs. However, remember to limit yourself to about fifteen segments; there is no need to create a complex structure.
If you want to use a template to build your RFM segmentation, feel free to use ours.
Just download it here 👇

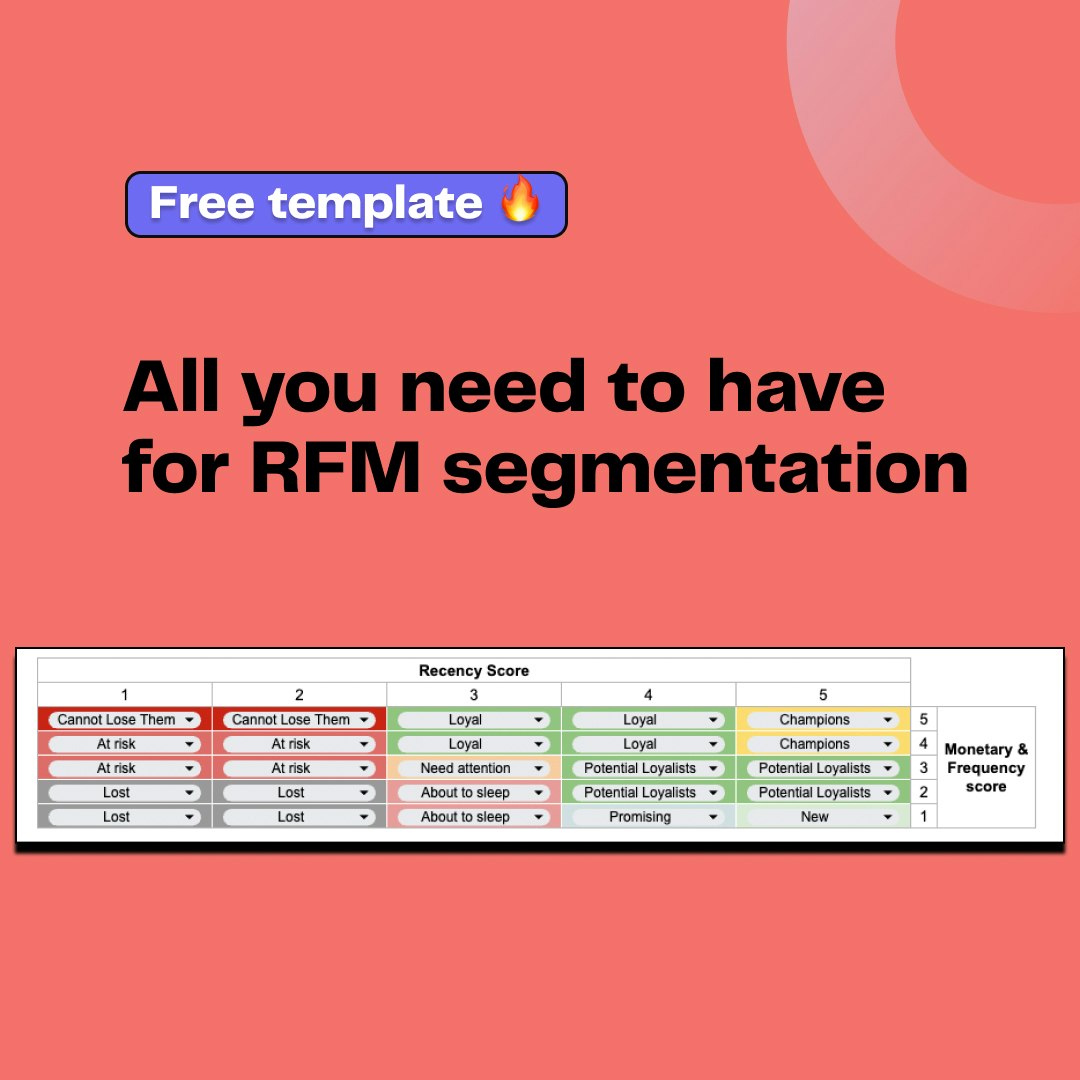
Having trouble segmenting your database?
Download our free RFM Template
All you need to have to perform RFM analysis: values, scores & results by segments
Of course, errors are human, and relying on Excel is not always the best option. By using DinMo, you can automatically calculate your RFM scores and modify any criteria (reference time, scale, number of segments, etc.) whenever you want. You can then use our Audience Manager to create your segments and send them to all your favorite platforms.
Marketing Strategies Based on RFM Segmentation
RFM insights represent a goldmine for defining customer profiles and potentials. Leveraging such information to refine your marketing strategies is crucial. Here, we detail three essential strategies centered around RFM segmentation: campaign targeting, individualization of the customer experience, and evaluation and optimization of marketing initiatives.
Utilize Segments for Targeted Campaigns
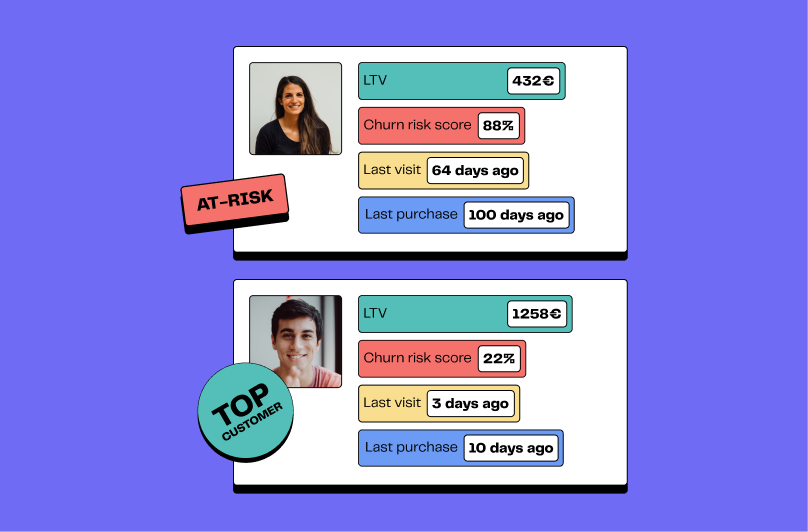
The benefit of RFM segmentation is its ability to classify customers based on their buying behavior, enabling the offering of perfectly aligned offers to their needs. It becomes possible to launch ultra-personalized marketing campaigns that increase loyalty, enhance customer lifetime value (LTV), and reduce churn.
In any case, keep in mind that audience strategies are essential to improve marketing performance.
Here are some examples of smart campaigns inspired by RFM segments:
Customers in the "Champions" segment can receive loyalty offers, VIP invitations, referral or review solicitations, or satisfaction surveys. However, be cautious not to over-solicit your best customers!
Customers with low recency but significant frequency or amount (aka Cannot Lose Them) can benefit from re-engagement offers, reminders for abandoned carts, recommendations for related products, or targeted surveys on their expectations to re-engage them with your brand.
Customers with high recency and moderate frequency or amount can enjoy attractive promotions or welcome offers (especially for New).
💡 We've prepared efficient emailing templates for those specific cases.
By tailoring the message, channel, and offer for each RFM segment, you significantly increase the interest and response of your audience.
Personalization of the Customer Experience
Customizing the customer experience based on RFM data is another effective marketing tactic that boosts engagement and consumer satisfaction. Let's illustrate some personalization tactics for different RFM segments:
"Champions" can enjoy a premium treatment, such as privileged access to customer support, personalized assistance, or exclusive privileges.
Customers who should not be lost can get an enhanced experience with personalized recommendations, expert reviews, or specific educational content to enable their re-engagement.
Adapting the user experience to each RFM category opens the door to increased loyalty and the transformation of customers into true brand ambassadors.
Measure and Optimize Marketing Actions with RFM
RFM segmentation can also serve as a barometer to measure effectiveness and fine-tune your marketing strategies. Leverage this technique for precise tracking and continuous improvement based on your performance data. Analyze your KPIs by segment, A/B test your campaigns and audiences, and adjust your strategies accordingly.


Overview of RFM performances
What's Next?
We hope this guide to RFM segmentation has answered your questions! If you want to delve into customer segmentation, don't hesitate and get started! And if you still have questions, contact us! It would be a pleasure to exchange ideas with you.